IEEE 1584 Incident Energy Calculator Guide (Level 1)
What is it?
This incident energy calculator is based upon IEEE 1584:2018 Guide for Performing Arc Flash Hazard Calculations. More information can be found in Chapter 4: Prediction and Chapter 14: Hazard and Severity Calculators.
Why would you use it?
Risk assessment is the bedrock of this guide in managing the arc flash hazard. Chapter 3: Risk Assessment and the 4P Guide explains that the first step is predicting the hazard severity and the incident energy calculator will allow you to determine the thermal effects of a possible arcing event.
Where would you use it?
As with all systems, the incident energy calculator has limitations; it cannot be applied to every situation. That said, the situations in which it can be applied are quite wide and varied. The IEEE 1584:2018 model, for which the incident energy calculator incorporates, is suitable for systems having:
- Voltages in the range of 208V to 15,000V. Three-phase.
- Frequencies of 50 or 60 Hz.
-
Bolted fault current (Prospective Short Circuit Current) in the range of:
- 700A to 106,000A for voltages between 208 and 600 volts.
- 200A to 65,000A for voltages between 601 and 15,000 volts.
- Working Distances greater than or equal to 305mm.
- Grounding of all types and Ungrounded.
- Equipment enclosures with a maximum height and width of 1244.6mm. The width must be larger than four times the gap between the conductors.
-
Gaps between conductors in the range of:
- 6.35mm to 76.2mm for voltages between 208 and 600 volts.
- 19.05mm to 254mm for voltages between 601 and 15,000 volts.
- Faults involving three phases only.
- AC (Alternating Current) Faults only.
How do you use it?
The following sets out how a competent electrical engineer can use the calculator to arrive at an incident energy level at a stated working distance as well as an arc flash boundary which is the distance at which the incident energy level equals 1.2 cal/cm2 (or the threshold of a second-degree burn).
Each calculator has a dropdown box with some instructions to assist the user, these instructions are far less detailed and only meant to provide some basic information.
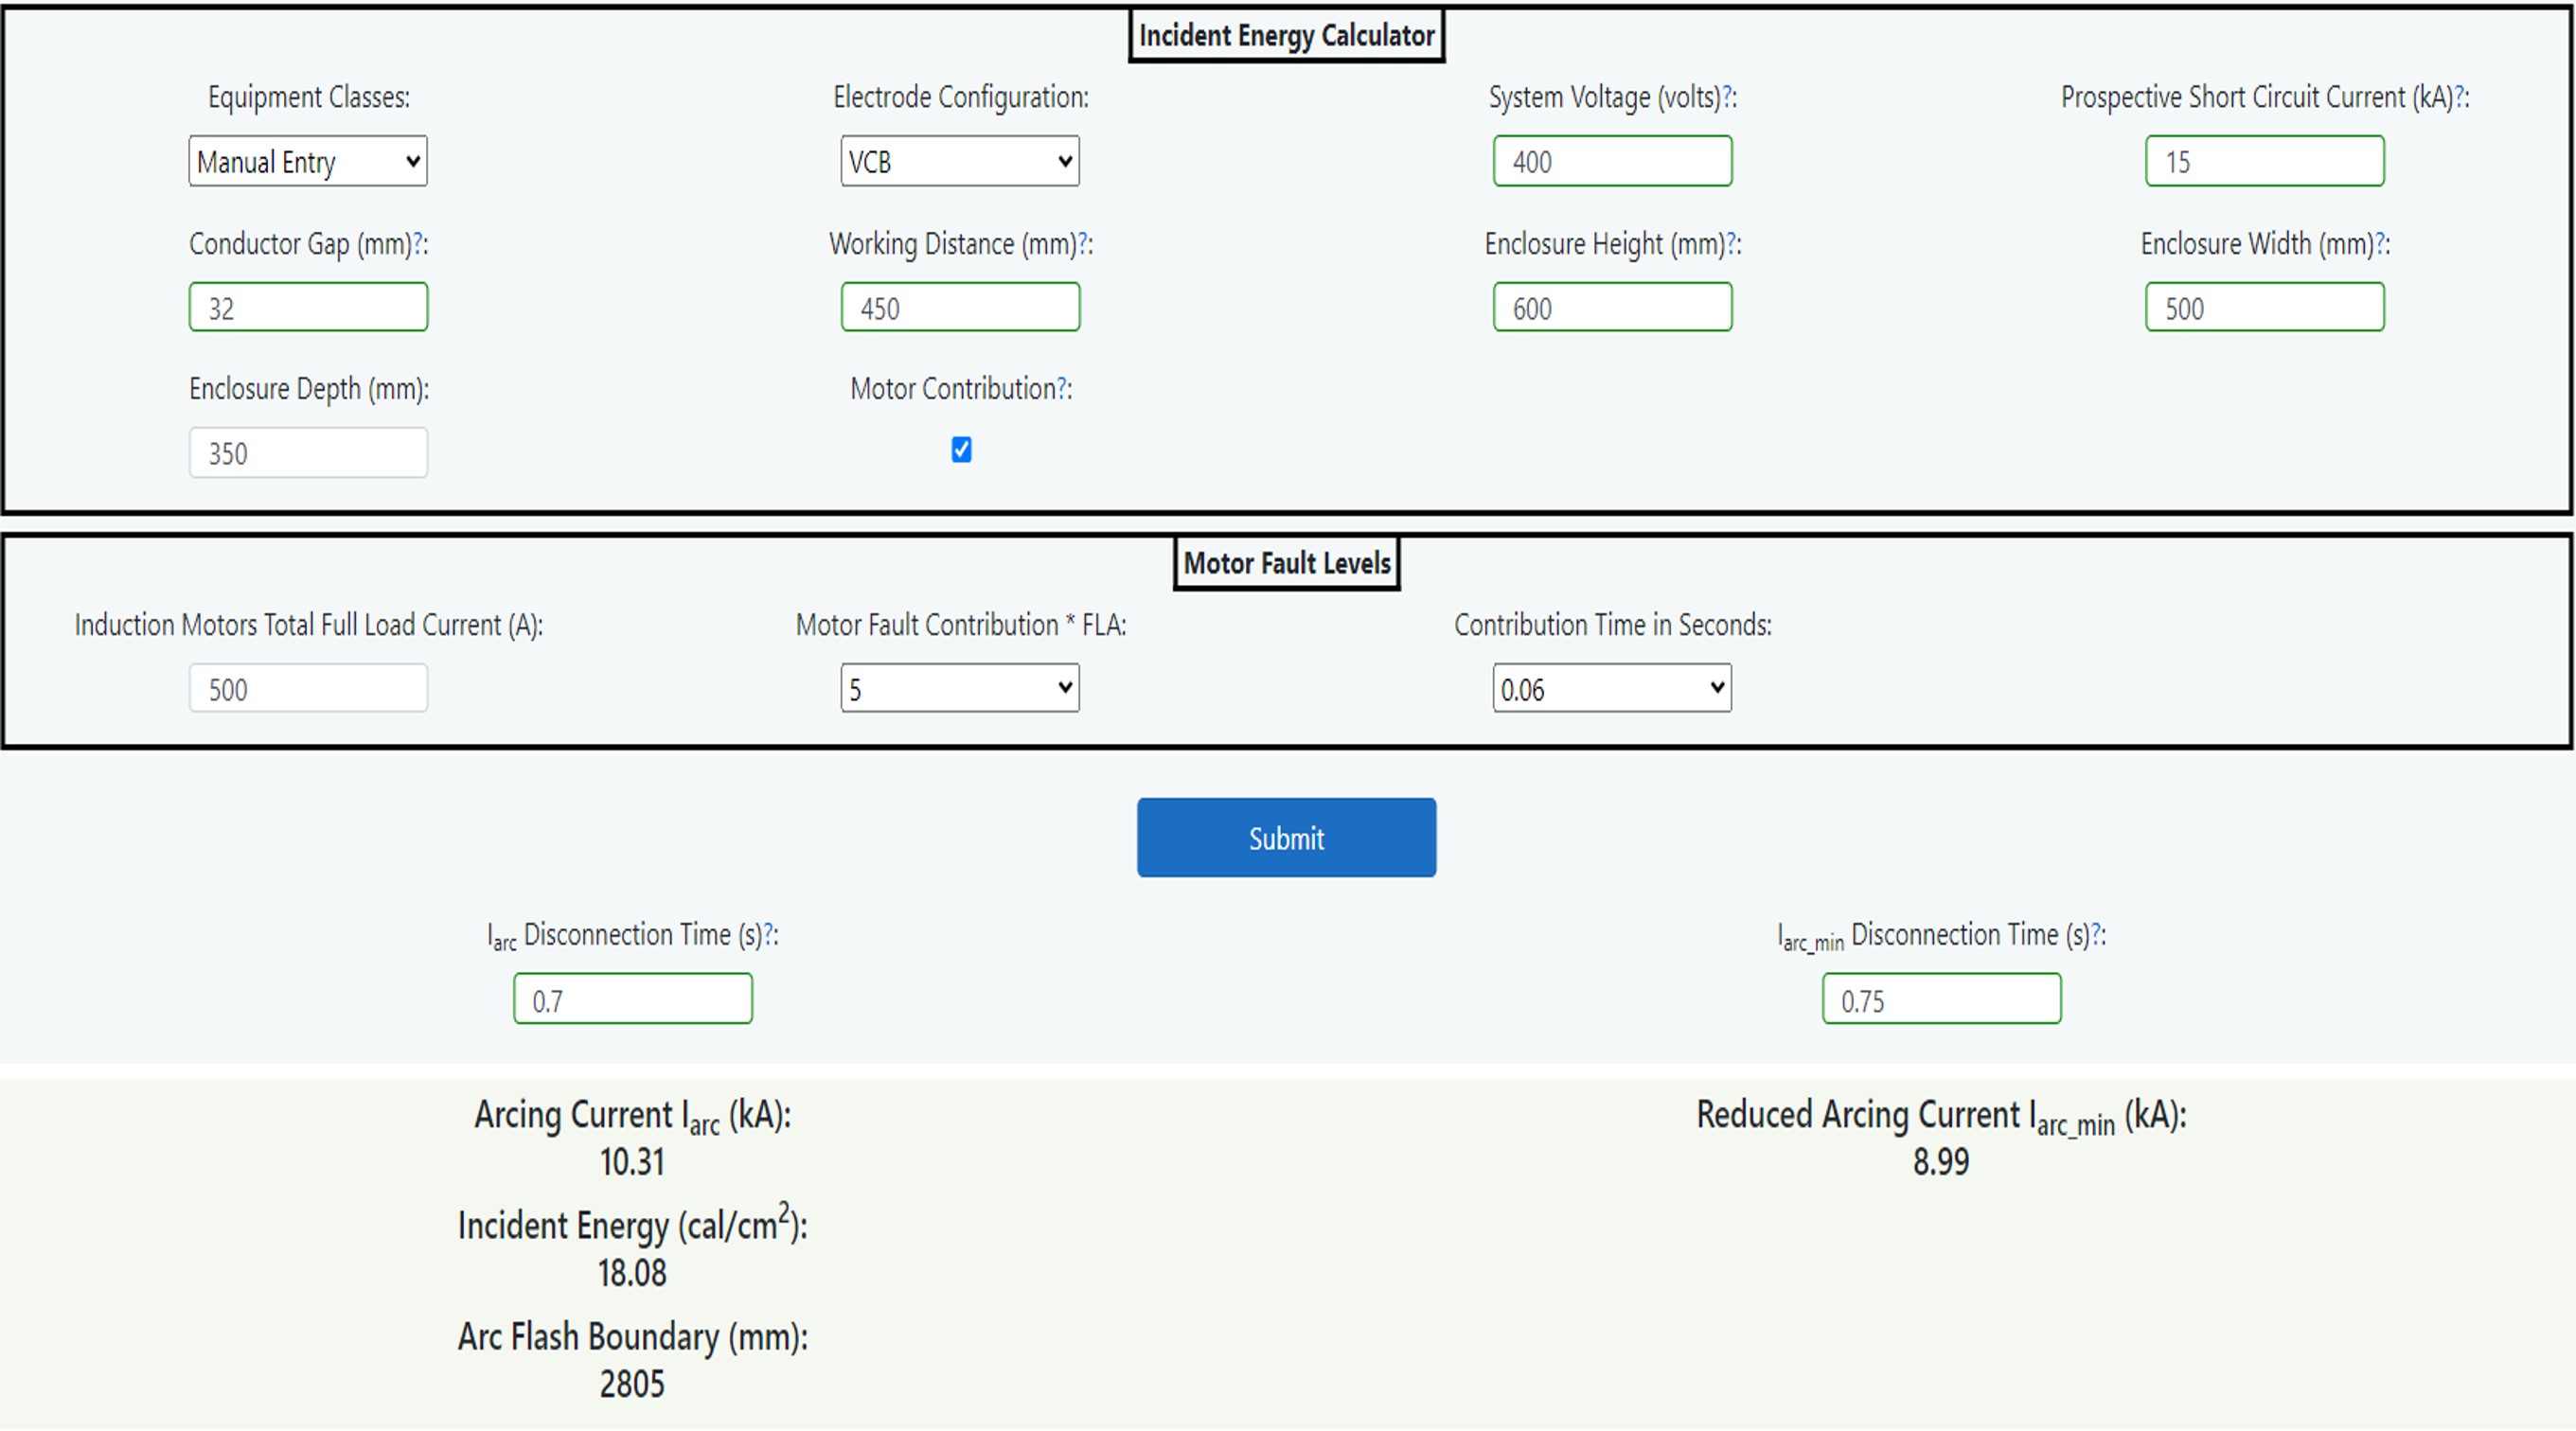
Figure 14.3 IEEE 1584 (Incident Energy) Calculator
Going through the data fields on the form these are described as follows.
Equipment Classes
This is a dropdown field where the user can choose between pre-determined equipment classes or enter bespoke information for conductor gap, working distance and enclosure size. The pre-determined equipment classes are listed as follows.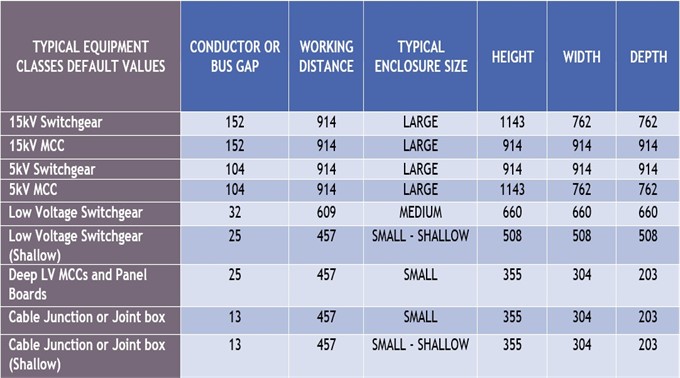
Table 14.4 Typical Equipment Classes
Selecting any of the typical equipment classes will return the corresponding values of conductor gap, working distance, and enclosure height, width, and depth. It is the user’s responsibility to verify that these values are reasonable as they can vary. (When using a pre-determined equipment class, the fields are not editable)
If the Manual Entry item is chosen, then the fields that were previously not editable become editable, at which point you can enter bespoke values of conductor gap, working distance and enclosure height, width, and depth manually. All the units are in mm.
Electrode Configuration
There are five different electrode configurations, and this field is a dropdown list giving choices as follows:
- VCB: Vertical conductors/electrodes inside a metal box/enclosure.
- VCBB: Vertical conductors/electrodes terminated in an insulating barrier inside a metal box/enclosure.
- HCB: Horizontal conductors/electrodes inside a metal box/enclosure.
- VOA: Vertical conductors/electrodes in open air.
- HOA: Horizontal conductors/electrodes in open air.
(In this case of VOA or HOA configurations, the enclosure height, width, and depth fields display as “NA” as an open air setup does not use these values.)
Chapter 8: Data Collection and Chapter 14: Hazard and Severity Calculations gives diagrams and describes which electrode configuration to use as the choice will determine not only the arcing current but also the incident energy & arc flash boundaries.
System Voltage (volts)
The three-phase line-to-line voltage in volts.
Prospective Short Circuit Current
This is the user’s estimate of prospective short circuit current in kA trying to take into account system variations.The user is advised to enter both upper and lower limits of prospective short circuit current to determine which produces the worst case incident energy. A lower short circuit current can result in a higher value of incident energy.
Conductor Gap (mm)
The gap between conductors may need some engineering judgement as described in Chapter 8: Data Collection. This is autofilled with the default values from equipment classes that are mentioned previously (or manually if the manual entry option is enabled).
Working Distance (mm)
The distance between the potential arc source (not just the front of the panel) and the face and chest of the worker. If any of the above equipment classes are chosen, this box will be auto filled from table 14.4 above.
Enclosure Height (mm)
Enter the height of the enclosure in mm. If any of the above equipment classes are chosen, this box will be auto filled from table 14.4 above. If electrode configurations VOA or HOA (arc in air) are selected previously, then this box will not be applicable.
Enclosure Width (mm)
Enter the width of the enclosure in mm. If any of the above equipment classes are chosen, this box will be auto filled from table 14.4 above. If electrode configurations VOA or HOA (arc in air) are selected previously, then this box will not be applicable.
Enclosure Depth (mm)
Enter the depth of the enclosure in mm. If any of the above equipment classes are chosen, this box will be auto filled from table 14.4 above. If electrode configurations VOA or HOA (arc in air) are selected previously, then this box will not be applicable.
Motor Contribution
This is a checkbox if you wish to add motor contribution. If there is significant contribution from induction motors, this will have the effect of increasing the prospective short circuit current for a finite time and therefore increasing the incident energy level. As can be seen in the diagram Figure 14.6 below, an amount of incident energy from the motor, which is represented by the pink box, is added to the calculated incident energy contribution from the utility.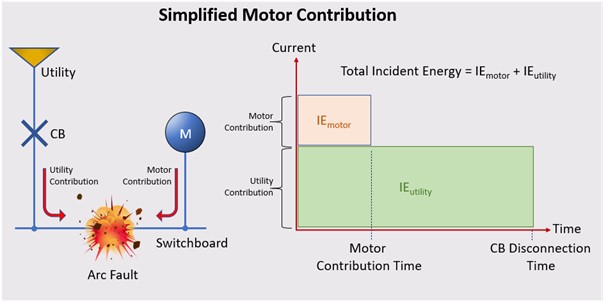
Figure 14.6 Motor Contribution
By ticking the Motor Contribution box, a separate control panel will be shown with the following fields.
Induction Motors Total Full Load Current
This field asks for the induction motor full load current in amperes which can be either a single or grouped motor load in amperes.
Motor Fault Contribution * FLA
This field is motor fault contribution times full load current which is an engineering judgement. A motor contribution of between four- and six-times full load current is usually acceptable.
Contribution Time in Seconds
The final field is a dropdown field for the motor contribution time in seconds. Again, this is to be based upon engineering judgement, but induction motor contribution typically lasts from one to four cycles (0.02 to 0.08 seconds at 50Hz) and synchronous motors, this can last from six to eight cycles (0.12 to 0.16 seconds). In summary, the IEEE 1584:2018 Calculator follows the logic in the flowchart given in Chapter 14: Hazard and Severity Calculations.For the sake of simplicity, the calculator shows motors connected downstream of the fault meaning that the sum of utility fault current plus motor fault current will be applied for whatever time that is entered into the motor contribution time field. This may give a slightly higher incident energy in cases where the protective device operates quicker than the motor contribution time. Motors that are connected upstream of the protective device need to be factored into the mains contribution which is derived from a separate fault level study as this may impact on the protective device operating time.
Submit Button (Clarification)
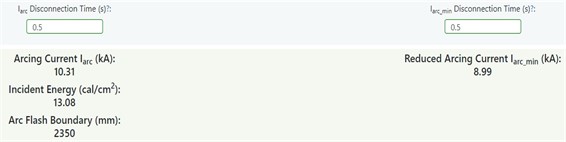
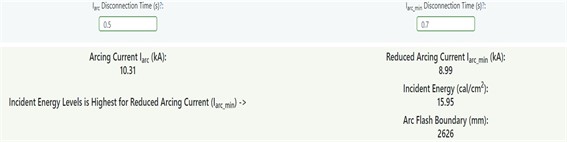
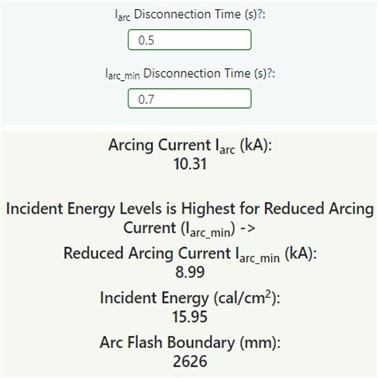
Press the submit button after the above data has been entered and this will return an arcing current Iarc and a reduced arcing current Iarc_min providing there are no invalid entries. After this you can determine an appropriate disconnection time to use for the upstream device to operate after which you would press the submit button again to ascertain the incident energy and arc flash boundary levels for this configuration.
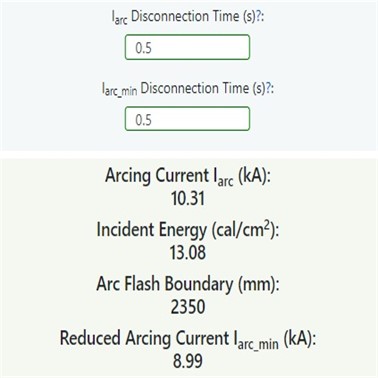
Iarc Disconnection Time
A value of time in seconds needs to be entered for the corresponding Arcing Current (I(arc). This will be from the upstream protection device time current curve. As shown below.
Iarc_min Disconnection Time
A value of time in seconds needs to be entered for the corresponding reduced arcing current (Iarc_min). This will be from the upstream protection device time current curve. As shown below.The example in Figure 14.5 is for a typical low voltage air circuit breaker and as can be seen the arcing current in this case is 12.2 kA (marked in blue) with a corresponding Iarc disconnection time is 0.06 seconds. The reduced arcing current Iarc_min is 9.9 kA (marked in green) with a corresponding Iarc_min disconnection time of 1.2 seconds.
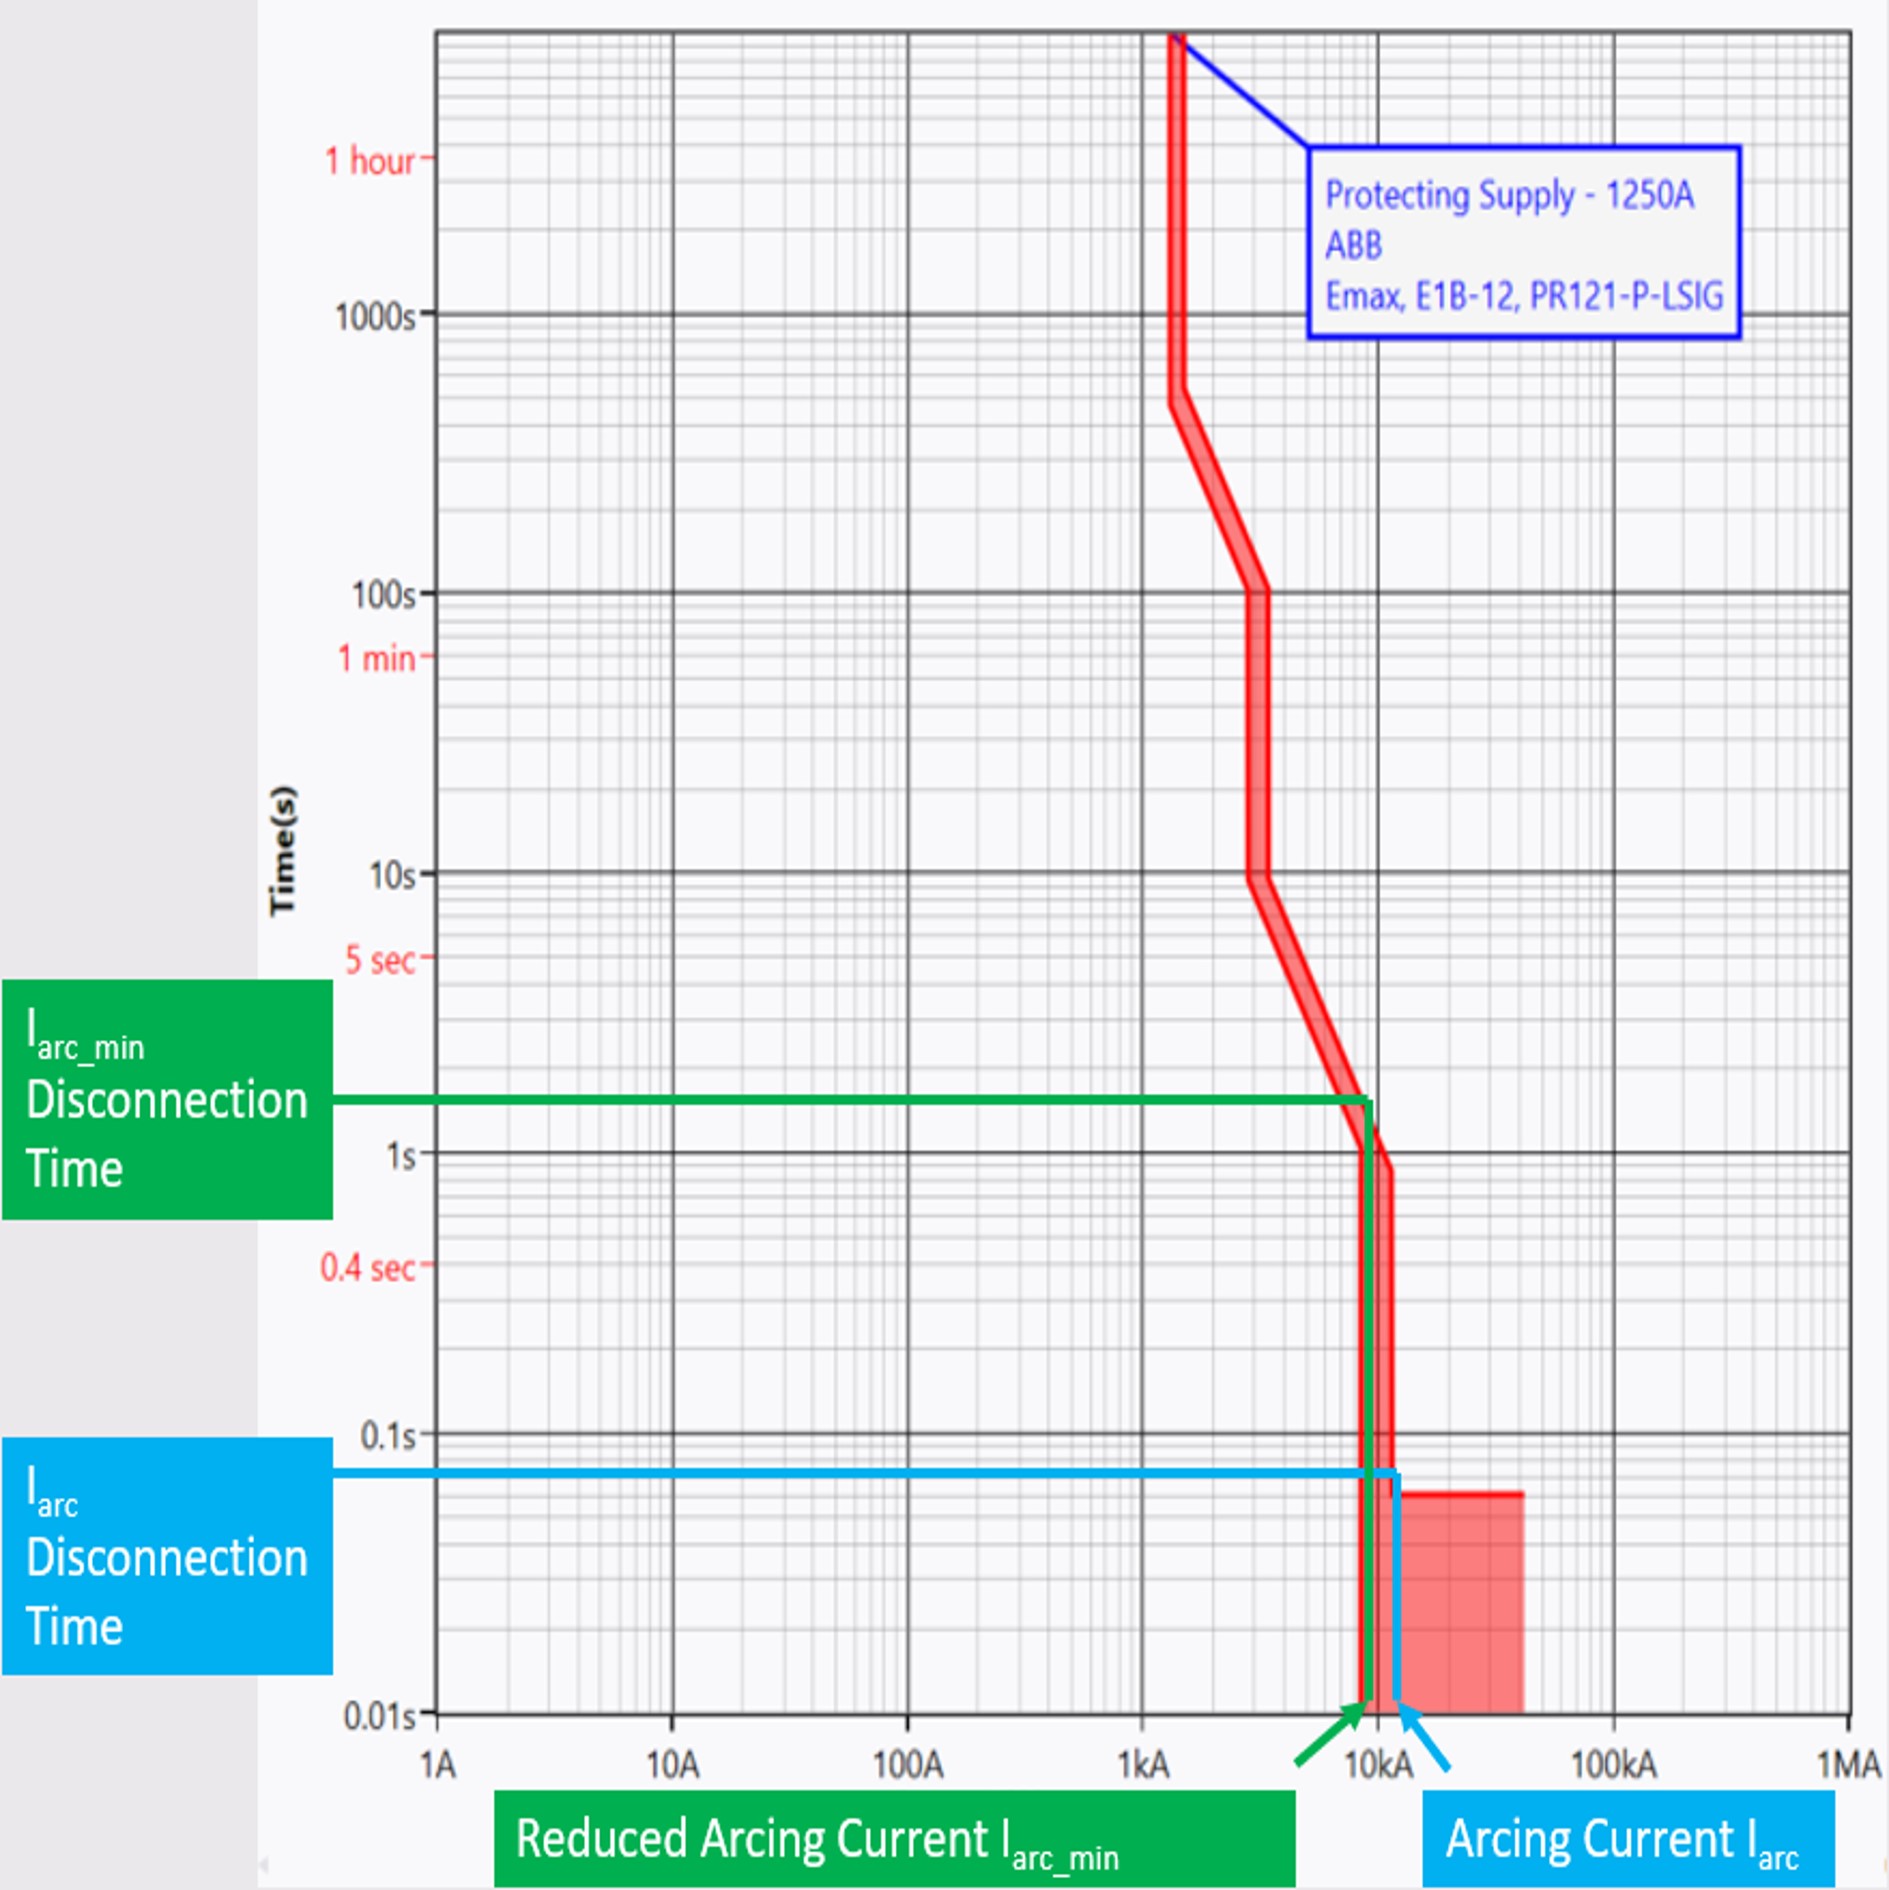
Figure 14.5 Arcing Current Variations
Further Important Information
All fields that have specific validation are accompanied with an instructional tooltip, denoted by a “?”.
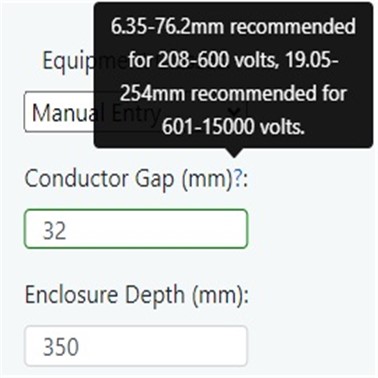
If the instruction is followed correctly, in most cases the field will appear green, if it is erroneous, it will appear red.
The “Conductor Gap (mm)” depicted in this image shows two ranges of possible entries. Outside these ranges will return a red box
Results
The results are displayed in two formats, the images are displayed in Desktop/Tablet view followed by Mobile view respectively:Format 1 where the arcing current and associated disconnection time returns the highest incident energy and arc flash boundary.
Format 2 displays the incident energy and arc flash boundary for the arcing current Iarc_min where this is higher than format 1. This is usually because of longer disconnection times due to the lower arcing current.
Note, the display may be different on mobile phones and tablets in landscape where the results will be in a single column rather than two columns above, as seen above.